Laboratory Training 5
Working with Java FX Graphics
1 Training Assignment
1.1 Individual Task
You should implement JavaFX GUI Application for plotting functions according to individual tasks. The main window of the program should contain
- visual elements that allow to enter
- values a and b,
- scale,
- graph display interval,
- the thickness of the lines;
- graph display panel;
- graph redraw button according to modified options.
Use the Canvas class to create graphics.
Variants of functions to choose for plotting and mandatory elements are given in the table:
Table 1.1 - Individual Assignments
|
# |
Function to draw |
Component to select the scale |
Component to select the line thickness |
# |
Function to draw |
Component to select the scale |
Component to select the line thickness |
|
1 |
a / (b sin x) |
Slider |
ScrollBar |
9 |
a sin x + b x | Spinner |
ScrollBar |
|
2 |
ax + b cos x |
ComboBox |
Slider |
10 |
(a cos x + b) / x | Slider |
ScrollBar |
|
3 |
(cos x + a) / (b sin x) |
Slider |
Spinner |
11 |
a + cos(b / x) | ScrollBar |
Spinner |
|
4 |
a / (b x sin x) |
ScrollBar |
Slider |
12 |
sin(a / x) + cos(b / x) | Spinner |
Slider |
|
5 |
a sin(b / x) |
ComboBox |
ScrollBar |
13 |
ax + b ctg x | Spinner |
ScrollBar |
|
6 |
ax - b tg x |
ScrollBar |
ComboBox |
14 |
a cos(b / x) | ComboBox |
ScrollBar |
|
7 |
a + sin(b / x) |
ScrollBar |
Spinner |
15 |
a + tg(b / x) | Slider |
ComboBox |
|
8 |
(a sin x + b) / x |
ScrollBar |
ComboBox |
16 |
a sin x + b cos x | ComboBox |
Spinner |
1.2 Testing of Array Items Summing
Design an ArraySum class to find the sum of array items. This class should contain the static sum() method that accepts an array as a parameter. Develop an ArraySumTest class for testing of ArraySum. Apply JUnit for testing. Add to the ArraySumTest class a method that tests the behavior of the ArraySum class when null value is sent as an argument of the sum() method (to test the expected exception).
1.3 Working with Geometric Shapes
Develop a program for the image of standard graphic primitives - square, rectangle, circle and ellipse. The user selects the desired shape using the RadioButton buttons
1.4 Using LineChart
Implement an individual task using the LineChart class.
2 Instructions
2.1 Testing Applications
2.2.1 Basic Concepts of Testing
Testing is one of the most important components of the software development process. Software testing is carried out in order to obtain information about the quality of the software product. There are many approaches and techniques that allow you to test and verify software.
The test-driven development paradigm defines a software development technique built on the use of tests, both to stimulate code writing and to test it. Development of the code is reduced to repeating the test-code-test cycle with subsequent refactoring.
The testing level that tests the least possible component for testing, such as a separate class or function, is called unit testing. The appropriate testing technology assumes that the tests are developed before writing the real code, and the development of the code of the unit (class) is completed when its code passes all the tests.
2.2.1 Java Tools for Diagnostics Runtime Errors
Many modern programming languages, including Java, include syntactic assertion mechanisms. The assert keyword appeared in Java starting with JDK 1.4 (Java 2). The use of assert construct can be turned on or off. If the diagnostic statements are enabled, the assert construct works as follows: the expression of boolean type is used and if the result is true, the program continues to work, otherwise an exception java.lang.AssertionError is thrown. Suppose, in accordance with the logic of the program, the variable c should always be positive. In this case, execution of such program fragment will not lead to any consequences (exceptions, emergency stop of the program, etc.):
int a = 10;
int b = 1;
int c = a - b;
assert c > 0;
If, due to the wrong software implementation of the algorithm, the variable c still received a negative value, executing a code fragment will throw an exception and a program will be terminated if the processing of this exception was not implemented:
int a = 10;
int b = 11;
int c = a - b;
assert c > 0; // exception throwing
After assertion, you can put a colon, after which to place some line of the message. For example:
int a = 10;
int b = 11;
int c = a - b;
assert c > 0 : "c cannot be negative";
In this case, the appropriate string is an exception message string.
Diagnostic statements are usually disabled in integrated environments. To enable assert execution in the Eclipse environment, use the Run | Run Configurations menu function, in the corresponding dialog box on the Arguments tab in the VM arguments field, enter -ea and execute the program.
Note: in IntelliJ IDEA environment there is a similar function of the Run | Edit Configurations menu. In the Run | Debug Configurations window, enter -ea in the input line of VM Options.
In the examples below, values that are checked with assert are not entered from the keyboard, but defined in the program in order to demonstrate the correct use of assert is to search for logical errors, and not to verify the correctness of user input. Exceptions, conditional statements, etc. should be used to verify the correctness of the data entered. Using assertion statements is not allowed, since at some point the program will be started without the -ea option and all assert statements will be ignored. Therefore, in the expression stated in the statement, it should not be foreseen actions that are important in terms of the functionality of the program. For example, if an assertion check is the only place in a program from which a very important function is called,
public static void main(String[] args) {
    //...
    assert f() : "failed";
    //...
}

public static boolean f() {
    // Very important calculations
    return true;
}
then after disabling checking the assertions, the function will not be called at all.
2.2.2 Basics of Using JUnit
Unlike the use of diagnostic statements, which tests the algorithms "from the inside", unit testing provides verification of a particular unit as a whole, testing the "outside" functionality of the unit.
The most common unit test support tool for Java software is JUnit, an open unit testing library. JUnit allows you to:
- create tests for individual classes;
- create test suites;
- create a series of tests on repeating sets of objects.
JUnit requires JDK to be used. The IntelliJ IDEA provides built-in support for JUnit, however, you can install the JUnit library manually by downloading JUnit distributions at the link https://github.com/junit-team/junit/wiki/Download-and-Install (junit-4.12.jar and hamcrest-core-1.3.jar).
To create a test, you need to create a class to test, and create a public class for testing with a set of methods that implement specific tests. Each test method should be public, void, without parameters. The method should be marked with a @Test annotation:
import org.junit.*;
public class MyTestCase {
    ...
    @Test
    public void testXXX() {
    ...
    }
    ...
}
Inside such methods, verification functions can be used:
assertTrue(expression);                 // completes the test with a failure if false
assertFalse(expression);                // completes the test with a failure if true
assertEquals(expected, actual);         // completes the test with a failure if not equals
assertNotNull(new MyObject(params));    // completes the test with a failure if null
assertNull(new MyObject(params));       // completes the test with a failure if not null
assertNotSame(expression1, expression2);// completes the test with a failure if both references point to the same object
assertSame(expression1, expression2);   // completes the test with a failure if the objects are different
fail(message)            // Immediately completes the test with a failure with the message output.
Here MyObject is the class that is being tested. Access to these Assert class methods is done using static import import static org.junit.Assert.*;. These methods also exist with the additional first parameter message of String type, which specifies the message to be displayed in the event of failure of the test.
If you need to perform some actions before performing the testing function, for example, formatting the values of variables, then such initialization is made in a separate method, preceded by the @Before annotation:
@Before
public void setup(){
      ...
}
For example:
import org.junit.*;
import static org.junit.Assert.*;

public class MyMathTest {
    private MyMath a;

    @Before
    public void setUp(){
        a = new MyMath();
    }

    @Test
    public void testAdd(){
        assertEquals(5, a.add(4, 1));
    }

    @Test
    public void testSub(){
        assertEquals(-1, a.sub(0, 1));
    }
}
Similarly, the methods that perform the actions required after testing, should be preceded by the @After annotation. The appropriate methods should be public static void.
The @Test(timeout=time) annotation, where time is time in milliseconds, allows you to specify the maximum amount of time allowed for this test. If the time limit is exceeded, the test fails.
The @Test(expected=SomeException.class) is used if it is necessary to check whether an attempt to perform a test results in throwing a SomeException exception.
If you need to temporarily ignore a test method, use the @Ignore annotation.
@Ignore
@Test(timeout = 1000)
public void testAdd() {
    //code
}
JUnit provides a mechanism for logical grouping of tests for their further joint execution. To do this, you should use the @RunWith annotation, in which we need to specify a class called Suite (sets of tests), as well as an annotation @SuiteClasses, whose parameter is a list of classes representing a set of tests:
import org.junit.runner.RunWith;
import org.junit.runners.Suite;
import org.junit.runners.Suite.SuiteClasses;

@RunWith(Suite.class)
@SuiteClasses({ TestSample1.class, TestSample2.class })
public class AllSuite {
}
To run a set of tests not from the IntelliJ IDEA environment, you need the following code:
import org.junit.runner.JUnitCore;
import org.junit.runner.Result;
import org.junit.runner.notification.Failure;

public class TestRunner {
    public static void main(String[] args) {
        Result result = JUnitCore.runClasses(AllSuite.class);
            for (Failure failure : result.getFailures()) {
                System.out.println(failure.toString());
            }
            System.out.println(result.wasSuccessful());
        }
    }
Suppose you need to test the Sample class with two methods:
package ua.in.iwanoff.java.fifth;

public class Sample {
    private String msg = "Hello";
    public static int add(int a, int b) { return a + b; } //static method
    public String getMsg() { return msg; } //non-static method
}
The test class will look like this:
package ua.in.iwanoff.java.fifth;

import org.junit.Test;
import static org.junit.Assert.*;
public class TestSample {

    // checking the static method for finding the sum
    @Test
    public void testAdd() {
        assertEquals(Sample.add(4,4), 8);
    }
    // checking the class initialization
    @Test
    public void testInit() {
        assertEquals(new Sample().getMsg(),"Hello");
    }
}
When testing the getMsg() method, it is not the code of this method that is tested first, but the creation of an instance of the class with the correct initialization of the msg field.
You can test methods that return void. Calling such a method involves performing an action (for example, creating a file, changing the value of a field, etc.). It is necessary to check whether such an action had taken place. For example:
void setValue(into value) {
    this.value = value;
}

...

public void testSetValue() {
    someObject.setValue(123);
    assertEquals(123, someObject.getValue());
}
However, as a rule, testing the simplest methods for accessing properties and setting properties (setters and getters) seems excessive and not recommended.
If you make mistakes in the code:
public class Sample {
    private String msg = "Hello";
    public static int add(int a, int b) { return a - b; }
    public String getMsg() { return msg; }
}
and repeat the test, you will receive error information.
2.2 JavaFX Standard Graphics Tools
2.2.1 Overview
The standardization of graphic tools at one time led to a significant acceleration in the development of video games and virtual reality. Graphics standardization at a low hardware and software level was first implemented in 1992 and is associated with the advent of OpenGL. OpenGL (Open Graphics Library) is a specification that defines an independent of the programming language cross-platform application programming interface (API) for writing applications that use 2D and 3D computer graphics. But even after the introduction of OpenGL, the standardization issue has remained at a higher level, where there are difficulties concerned with differences in architecture, technical devices, and operating systems. The great advantage of Java is the ability to work with cross-platform graphics. Java graphics do not depend on the features of operating systems and specific devices. It includes both the possibility of low-level work with graphic objects and files, as well as high-level operations on image processing, plotting charts and diagrams, and so on.
The first version of Java included a limited set of graphic primitives without the ability to determine the thickness and properties of the lines, the minimum expressive means needed to implement applets. Graphics features have been encapsulated in the Graphics class, which could be obtained as a parameter to the paint() method, defined for a specific component, such as a panel of the AWT library.
The Java 2D API provides the user with an advanced set of two-dimensional graphics. Since the JDK 1.2 version, Sun has included a more powerful java.awt.Graphics2D graphics package. This set of graphical tools supports the design of various lines, text, images, has a rich and full-featured interface for programmers.
In particular, API supports:
- generalized graphic display model for output devices (monitors, printers);
- a wide range of geometric primitives, such as curves, rectangles, ellipses, as well as a mechanism for drawing almost any geometric shape;
- a mechanism for detecting defects of graphic forms, text and images;
- control mechanism for overlapping objects;
- advanced color support;
- support for printing complex documents.
The main drawing mechanism in java.awt.Graphics2D is the same as in previous versions of JDK: the graphical system manages when and what the program should draw. When a component has to display itself on the screen, its paint() or update() method is automatically called with its corresponding Graphics context.
Unlike previous versions that implemented the imperative approach, JavaFX graphics implement a declarative approach that involves adding graphic primitives to the panel. Reshaping the image will be done automatically whenever necessary.
JavaFX graphics are implemented at different levels:
- use of canvas;
- use objects of classes derived from the
Shapeclass; - use of high-level objects for the construction of diagrams and charts.
2.2.2 Using the Canvas Class Capabilities
The concept of canvas is typical for almost all modern graphics systems. Typically, canvas encapsulates the ability to draw graphic primitives. In JavaFX Canvas is a class that represents a node in the scene graph. With each canvas, the so-called graphics context is concerned: an object of the type GraphicsContext, which provides functions for drawing lines, geometric shapes, text, as well as support for visual effects and graphic transformations.
A Canvas object can be created using two constructors. In addition to the constructor without parameters, there is a constructor that determines the size of the canvas. If we want to draw in the entire panel (panel object), the Canvas object can be created as follows:
Canvas canvas = new Canvas(panel.getWidth(), panel.getHeight());
You can use the getGraphicsContext2D() method to get a GraphicsContext object. This is a static factory method of the Canvas class. For example:
GraphicsContext gc = canvas.getGraphicsContext2D();
Conceptually, the Canvas class implements a procedural approach to creating graphics. You can consider GraphicContext as a finite-state machine, which consistently perform drawing of graphic primitives depending on its state. You can define the state for the color, thickness, and type of lines (respectively setStroke(), setLineWidth()), as well as for fill color (setFill()). You can also set the line type and fill. The predefined settings will work until new values are set. After creating an object of type Canvas set the default values of colors (black), the thickness of lines is 1.
The easiest way to define a color is to use the javafx.scene.paint.Color class constants, such as Color.RED, Color.GREEN, Color.BROWN, etc. In addition to the constants, the Color class provides several static functions for determining the required color, including Color.rgb(), Color.hsb(), etc.
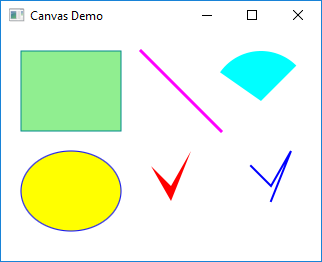
There are ready-made methods of the GraphicsContext class for drawing lines, rectangles, ellipses, polygons, arcs, broken lines, etc. The following example demonstrates the capabilities of the Canvas class for displaying some typical graphic primitives:
package ua.in.iwanoff.java.fifth;

import javafx.application.Application;
import javafx.scene.Scene;
import javafx.scene.canvas.Canvas;
import javafx.scene.canvas.GraphicsContext;
import javafx.scene.layout.AnchorPane;
import javafx.scene.paint.Color;
import javafx.scene.shape.ArcType;
import javafx.stage.Stage;

public class CanvasDemo extends Application {
    @Override
    public void start(Stage primaryStage) {
        primaryStage.setTitle("Canvas Demo");
        AnchorPane root = new AnchorPane();
        Scene scene = new Scene(root, 320, 230);
        // Create canvas and graphics context
        Canvas canvas = new Canvas(root.getWidth(), root.getHeight());
        GraphicsContext gc = canvas.getGraphicsContext2D();

        // Rectangle:
        gc.setStroke(Color.DARKCYAN);
        gc.setFill(Color.LIGHTGREEN);
        gc.fillRect(20, 20, 100, 80);
        gc.strokeRect(20, 20, 100, 80);

        // Segment:
        gc.setStroke(Color.MAGENTA);
        gc.setLineWidth(3);
        gc.strokeLine(140, 20, 220, 100);

        // Sector:
        gc.setFill(Color.AQUA);
        gc.fillArc(210, 20, 100, 100, 45, 100, ArcType.ROUND);

        // Ellipse:
        gc.setStroke(Color.BLUE);
        gc.setFill(Color.YELLOW);
        gc.setLineWidth(1);
        gc.fillOval(20, 120, 100, 80);
        gc.strokeOval(20, 120, 100, 80);

        // Polygon:
        gc.setFill(Color.RED);
        double[] xPoints = { 150, 170, 190, 170 };
        double[] yPoints = { 135, 155, 120, 170 };
        gc.fillPolygon(xPoints, yPoints, xPoints.length);

        // Polygonal chain:
        gc.setLineWidth(2);
        gc.setFill(Color.DARKBLUE);
        xPoints = new double[] { 250, 270, 290, 270 };
        yPoints = new double[] { 135, 155, 120, 170 };
        gc.strokePolyline(xPoints, yPoints, xPoints.length);

        // Add the canvas to the panel:
        root.getChildren().add(canvas);
        primaryStage.setScene(scene);
        primaryStage.show();
    }

    public static void main(String[] args) {
        launch(args);
    }
}
The main window of the program will look like this:
2.2.3 Use of Standard Geometric Shapes
Object-oriented approach to graphics in JavaFX most clearly manifested in the application of standard class objects that represent the most used graphic primitives. In this case, the construction of complex images involves creating a set of objects of different types, derived from javafx.scene.shape.Shape. Necessary sizes and coordinates can be defined both in the constructor and using separate setters. As with Canvas, objects can define fill properties (setFill()) and a path ((setStroke()).
The following program demonstrates the ability to create and configure some objects derived from Shape:
package ua.in.iwanoff.java.fifth;

import javafx.application.Application;
import javafx.geometry.Insets;
import javafx.scene.Scene;
import javafx.scene.layout.VBox;
import javafx.scene.layout.HBox;
import javafx.scene.paint.Color;
import javafx.stage.Stage;
import javafx.scene.shape.*;

public class ShapesDemo extends Application {
    @Override
    public void start(Stage primaryStage) {
        primaryStage.setTitle("Shapes Demo");

        // Rectangle:
        Rectangle rectangle = new Rectangle(100, 80); // sizes
        rectangle.setStroke(Color.BROWN);
        rectangle.setFill(Color.YELLOWGREEN);

        // Circle:
        Circle circle = new Circle(35.0); // radius
        circle.setCenterX(80.0);
        circle.setCenterY(80.0);
        circle.setFill(Color.CHOCOLATE);

        // Arc:
        // In the constructor we define center, radius, start and length in degrees
        Arc arc = new Arc(100, 100, 50, 50, 45, 135);
        arc.setType(ArcType.ROUND);
        arc.setFill(Color.DARKGRAY);

        // Ellipse:
        Ellipse ellipse = new Ellipse(50, 40);
        ellipse.setStroke(Color.DARKBLUE);
        ellipse.setFill(Color.LIGHTGOLDENRODYELLOW);

        // Polygon:
        Polygon polygon = new Polygon();
        polygon.setFill(Color.RED);
        // Add pairs of coordinates of the vertices.
        // The last vertex connects to the first one:
        polygon.getPoints().addAll(10.0, 15.0,
                                   30.0, 35.0,
                                   50.0, 00.0,
                                   30.0, 50.0);

        // Bezier curve:
        CubicCurve cubic = new CubicCurve();
        cubic.setFill(Color.TRANSPARENT);
        cubic.setStroke(Color.DARKGREEN);
        // Beginning:
        cubic.setStartX(0.0);
        cubic.setStartY(100.0);
        // Points on which the curvature of the Bezier curve depends:
        cubic.setControlX1(25.0);
        cubic.setControlY1(0.0);
        cubic.setControlX2(75.0);
        cubic.setControlY2(100.0);
        // End:
        cubic.setEndX(100.0);
        cubic.setEndY(50.0);

        HBox hBoxFirst = new HBox();
        hBoxFirst.setPadding(new Insets(10, 10, 10, 10));
        hBoxFirst.setSpacing(10);
        hBoxFirst.getChildren().addAll(rectangle, circle, arc);
        HBox hBoxSecond = new HBox();
        hBoxSecond.setPadding(new Insets(10, 10, 10, 10));
        hBoxSecond.setSpacing(10);
        hBoxSecond.getChildren().addAll(ellipse, polygon, cubic);
        VBox vBox = new VBox();
        vBox.getChildren().addAll(hBoxFirst, hBoxSecond);
        vBox.setSpacing(10);
        vBox.setPadding(new Insets(10, 10, 10, 10));
        Scene scene = new Scene(vBox,  320, 250);
        primaryStage.setScene(scene);
        primaryStage.show();
    }

    public static void main(String[] args) {
        launch(args);
    }
}
The main window of the application will look like this:
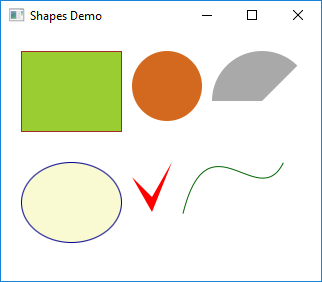
Among the objects created there is the so-called Bezier curve, named in honor of the French engineer, the inventor of a special kind of so-called cubic splines. In modern graphic systems, Bezier curves are often used to approximate arbitrary smooth contours.
In addition to the figures below, the javafx.scene.shape package also contains primitives that are used as projections of three-dimensional objects.
2.2.4 Standard Tools for Creating Graphs and Diagrams
The standard JavaFX tools provide ready-made components for plotting and charting. The Abstract Class Chart is a base for all charts and diagrams and combines the properties of all components intended to visualize numeric data. Directly derived from it are the PieChart and XYChart classes. The XYChart class is also abstract and serves as the base class for all other charts: AreaChart, BarChart, BubbleChart, LineChart, ScatterChart, StackedAreaChart, and StackedBarChart.
The constructors of classes derived from XYChart require the definition of two objects of the Axis type. Axis is an abstract class for representing an axis on a chart or diagram. The objects of derived CategoryAxis class are used when some strings are allocated along the axis. Another derived type is an abstract ValueAxis class. The NumberAxis class derived from ValueAxis is used when the axis represents a scale of numeric values.
The following example demonstrates the possibilities of constructing some diagrams:
package ua.in.iwanoff.java.fifth;

import javafx.application.Application;
import javafx.collections.FXCollections;
import javafx.geometry.Insets;
import javafx.scene.Scene;
import javafx.scene.chart.*;
import javafx.scene.chart.XYChart.Series;
import javafx.scene.layout.HBox;
import javafx.stage.Stage;

public class ChartDemo extends Application {

    @Override
    public void start(Stage primaryStage) {
        primaryStage.setTitle("Chart Demo");

        PieChart pieChart = new PieChart();
        pieChart.setMinWidth(300);
        pieChart.setTitle("Pie Chart");
        pieChart.getData().addAll(new PieChart.Data("two", 2),
                                  new PieChart.Data("three", 3),
                                  new PieChart.Data("one", 1));

        XYChart.Data<String, Number>[] barData = new XYChart.Data[] {
                                  new XYChart.Data<>("one", 2.0),
                                  new XYChart.Data<>("two", 3.0),
                                  new XYChart.Data<>("three", 1.0) };
        BarChart<String, Number> barChart = new BarChart<>(new CategoryAxis(), new NumberAxis());
        barChart.setTitle("Bar Chart");
        barChart.getData().addAll(new Series<>("Bars", FXCollections.observableArrayList(barData)));

        XYChart.Data<Number, Number>[] xyData = new XYChart.Data[] {
                new XYChart.Data<>(1.0, 2.0),
                new XYChart.Data<>(2.0, 3.0),
                new XYChart.Data<>(3.0, 1.0) };
        AreaChart<Number, Number> areaChart = new AreaChart<>(new NumberAxis(), new NumberAxis());
        areaChart.setTitle("Area Chart");
        areaChart.getData().addAll(new Series<>("Points", FXCollections.observableArrayList(xyData)));
        // Uses the same data set
        BubbleChart<Number, Number> bubbleChart = new BubbleChart<>(
                new NumberAxis(0, 4, 1), new NumberAxis(0, 5, 1));
        bubbleChart.setTitle("Bubble Chart");
        bubbleChart.getData().addAll(new Series<>("Bubbles", FXCollections.observableArrayList(xyData)));

        HBox hBox = new HBox();
        hBox.getChildren().addAll(pieChart, barChart, areaChart, bubbleChart);
        hBox.setSpacing(10);
        hBox.setPadding(new Insets(10, 10, 10, 10));

        Scene scene = new Scene(hBox,  1000, 350);
        primaryStage.setScene(scene);
        primaryStage.show();
    }

    public static void main(String[] args) {
        launch(args);
    }
}
The main window of the application will look like this:
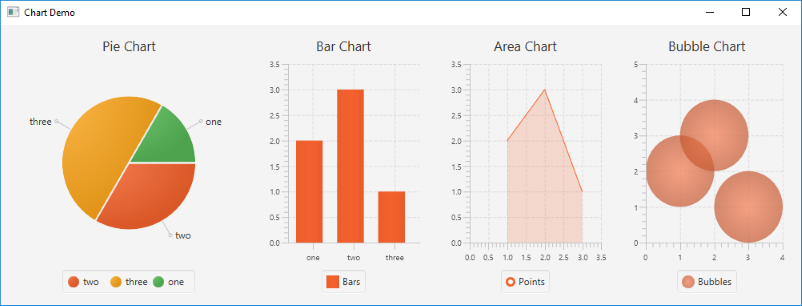
For charts derived from XYChart, you can define multiple data sets (Series) to visually compare different dependencies.
3 Sample Programs
3.1 Using JUnit in the IntelliJ IDEA Environment
Suppose a Product class is created in IntelliJ IDEA:
package ua.in.iwanoff.java.fifth;

public class Product {
    public static int multiply(int a, int b) {
        return a * b;
    }
}
In order to create a test class, we first select a project in a tree and create a new folder (File | New | Directory), for example, with the name test. Next, in the Project structure settings (File | Project Structure...), we will find a new folder for the Modules settings in the tree and select Tests in the Mark as list.
Returning to the code editing window and selecting the class name, we press Alt-Enter. In the list that appeared after that, we select Create Test. The Create Test dialog appears, in which we should select the library Testing library, in our case, JUnit4. If the project is tested for the first time, the next line will display JUnit4 library not found in the module with the Fix button. We click this button, and now we'll see another dialog where we select 'JUnit4' from IntelliJ IDEA distribution and click OK. Returning to the previous dialog, we select the functions that will be tested. In our case, this is a multiply() method.
In the test folder, a package structure that reflects the package structure of the project will be created. Also, the ProductTest class will be generated with the following source code:
package ua.in.iwanoff.java.fifth;

import org.junit.Test;

import static org.junit.Assert.*;

public class ProductTest {

    @Test
    public void multiply() throws Exception {
    }

}
Now within the code we can place a call to the functions that carry out the verification of assertions. In our case, the code within the multiply() function of the ProductTest class will be:
assertEquals(12, Product.multiply(3, 4));
The test function can be started using the main menu: Run | Run..., then ProductTest.multiply. If the test was successful, a green bar and the text 1 test passed appear in a title bar of the console window.
You can make errors in the code of the multiply() function of the Product class, for example,
return a * b + 1;
Now, the execution of ProductTest.multiply() will cause a red strip, text 1 test failed, and an error message in the console window.
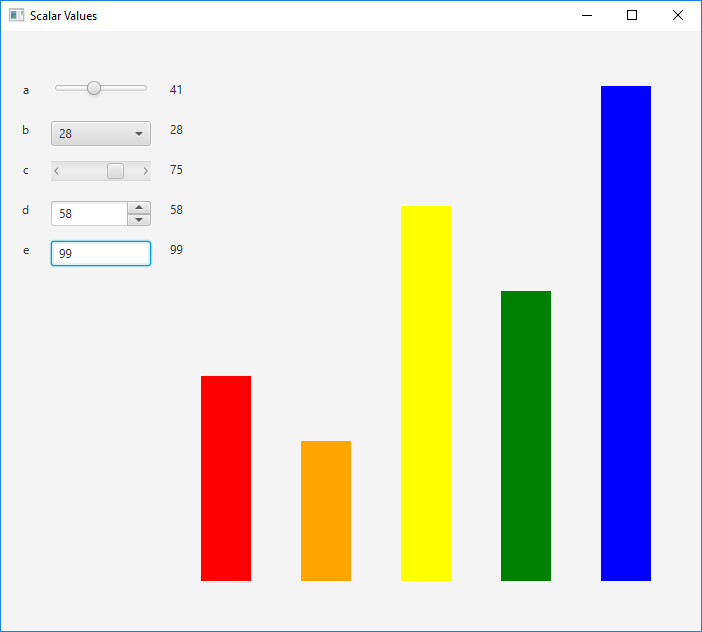
3.2 Diagram of Scalar Values
Suppose we need to create a graphical user interface application in which user enters five scalar values from 0 to 100 and gets representation of these values in a column diagram. The value of a should be entered using the Slider component, b should be input using the ComboBox component, c should be set using the ScrollBar component, d will be set through the Spinner component, and e wil be typed in TextField. Work with the program should consist in editing data with the simultaneous display of the values in the diagram.
All necessary components can be specified in the FXML file:
<?xml version="1.0" encoding="UTF-8"?>

<?import javafx.geometry.*?>
<?import javafx.scene.control.*?>
<?import java.lang.*?>
<?import javafx.scene.layout.*?>
<?import javafx.scene.layout.AnchorPane?>
<?import javafx.scene.layout.VBox?>
<?import javafx.scene.layout.HBox?>
<?import javafx.scene.control.Label?>
<?import javafx.scene.control.TextField?>
<?import javafx.scene.control.ComboBox?>
<?import javafx.scene.control.ScrollBar?>
<?import javafx.scene.control.Slider?>

<?import javafx.scene.shape.Rectangle?>
<AnchorPane minHeight="150" minWidth="250" prefHeight="400.0" prefWidth="600.0"
            fx:controller="ua.in.iwanoff.java.fifth.DiagramController"
            xmlns:fx="http://javafx.com/fxml/1"
            xmlns="http://javafx.com/javafx/8">
    <children>
        <VBox minWidth="200.0" prefWidth="200.0" AnchorPane.topAnchor="50">
            <children>
                <HBox prefHeight="40.0" minHeight="40.0">
                    <children>
                        <Label prefWidth="50.0" text="a" alignment="CENTER"/>
                        <Slider fx:id="sliderA" prefWidth="100.0" />
                        <Label fx:id="labelA" prefWidth="50.0" text="50" alignment="CENTER" />
                    </children>
                </HBox>
                <HBox prefHeight="40.0" minHeight="40.0">
                    <children>
                        <Label prefWidth="50.0" text="b" alignment="CENTER"/>
                        <ComboBox fx:id="comboBoxB" prefWidth="100.0" />
                        <Label fx:id="labelB" prefWidth="50.0" text="50" alignment="CENTER" />
                    </children>
                </HBox>
                <HBox prefHeight="40.0" minHeight="40.0">
                    <children>
                        <Label prefWidth="50.0" text="c" alignment="CENTER"/>
                        <ScrollBar fx:id="scrollBarC" prefWidth="100.0" prefHeight="20.0"/>
                        <Label fx:id="labelC" prefWidth="50.0" text="50" alignment="CENTER" />
                    </children>
                </HBox>
                <HBox prefHeight="40.0" minHeight="40.0">
                    <children>
                        <Label prefWidth="50.0" text="d" alignment="CENTER"/>
                        <Spinner fx:id="spinnerD" prefWidth="100.0" />
                        <Label fx:id="labelD" prefWidth="50.0" text="50" alignment="CENTER" />
                    </children>
                </HBox>
                <HBox prefHeight="40.0" minHeight="40.0">
                    <children>
                        <Label prefWidth="50.0" text="e" alignment="CENTER"/>
                        <TextField fx:id="textFieldE" prefWidth="100.0" />
                        <Label fx:id="labelE" prefWidth="50.0" text="50" alignment="CENTER" />
                    </children>
                </HBox>
            </children>
        </VBox>
        <Rectangle fx:id="rectangleA" AnchorPane.leftAnchor="200.0" AnchorPane.bottomAnchor="50"
                   width = "50" height="250" fill="red"/>
        <Rectangle fx:id="rectangleB" AnchorPane.leftAnchor="300.0" AnchorPane.bottomAnchor="50"
                   width = "50" height="250" fill="orange"/>
        <Rectangle fx:id="rectangleC" AnchorPane.leftAnchor="400.0" AnchorPane.bottomAnchor="50"
                   width = "50" height="250" fill="yellow"/>
        <Rectangle fx:id="rectangleD" AnchorPane.leftAnchor="500.0" AnchorPane.bottomAnchor="50"
                   width = "50" height="250" fill="green"/>
        <Rectangle fx:id="rectangleE" AnchorPane.leftAnchor="600.0" AnchorPane.bottomAnchor="50"
                   width = "50" height="250" fill="blue"/>
    </children>
</AnchorPane>
The controller class will look like this:
package ua.in.iwanoff.java.fifth;

import java.net.URL;
import java.util.ResourceBundle;

import javafx.beans.value.ObservableValue;
import javafx.fxml.FXML;
import javafx.fxml.Initializable;
import javafx.scene.control.*;
import javafx.scene.shape.Rectangle;

public class DiagramController implements Initializable {
    @FXML private Slider sliderA;
    @FXML private ComboBox<Integer> comboBoxB;
    @FXML private ScrollBar scrollBarC;
    @FXML private Spinner<Integer> spinnerD;
    @FXML private TextField textFieldE;

    @FXML private Label labelA;
    @FXML private Label labelB;
    @FXML private Label labelC;
    @FXML private Label labelD;
    @FXML private Label labelE;

    @FXML private Rectangle rectangleA;
    @FXML private Rectangle rectangleB;
    @FXML private Rectangle rectangleC;
    @FXML private Rectangle rectangleD;
    @FXML private Rectangle rectangleE;

    @Override
    public void initialize(URL location, ResourceBundle resources) {
        sliderA.setValue(50);
        sliderA.valueProperty().addListener(this::aChanged);
        for (int i = 0; i <= 100; i++) {
            comboBoxB.getItems().add(i);
        }
        comboBoxB.getSelectionModel().select(50);
        comboBoxB.getSelectionModel().selectedItemProperty().addListener(this::bChanged);
        scrollBarC.setValue(50);
        scrollBarC.valueProperty().addListener(this::cChanged);
        SpinnerValueFactory.IntegerSpinnerValueFactory valueFactory =
                new SpinnerValueFactory.IntegerSpinnerValueFactory(0, 100);
        valueFactory.setValue(50);
        spinnerD.setValueFactory(valueFactory);
        spinnerD.valueProperty().addListener(this::dChanged);
        textFieldE.setText("50");
        textFieldE.textProperty().addListener(this::eChanged);
    }

    private void aChanged(ObservableValue<? extends Number> observableValue, Number oldValue, Number newValue) {
        labelA.setText(Math.round(newValue.intValue()) + "");
        rectangleA.setHeight(newValue.intValue() * 5);
    }

    private void bChanged(ObservableValue<? extends Integer> observableValue, Integer oldValue, Integer newValue) {
        labelB.setText(Math.round(newValue.intValue()) + "");
        rectangleB.setHeight(newValue.intValue() * 5);
    }

    private void cChanged(ObservableValue<? extends Number> observableValue, Number oldValue, Number newValue) {
        labelC.setText(Math.round(newValue.intValue()) + "");
        rectangleC.setHeight(newValue.intValue() * 5);
    }

    public void dChanged(ObservableValue<? extends Integer> observable, Integer oldValue, Integer newValue) {
        labelD.setText(Math.round(newValue.intValue()) + "");
        rectangleD.setHeight(newValue.intValue() * 5);
    }

    public void eChanged(ObservableValue<? extends String> observable, String oldValue, String newValue) {
        int value;
        try {
            if (oldValue.length() == 0) {
                oldValue = labelE.getText();
            }
            value = Integer.parseInt(newValue);
            if (value > 100 || value < 0) {
                textFieldE.setText(oldValue);
                return;
            }
            rectangleE.setHeight(value * 5);
            labelE.setText(newValue);
        }
        catch (NumberFormatException e) {
            if (textFieldE.getText().length() > 0) {
                textFieldE.setText(oldValue);
            }
        }
    }
}
As you can see from the above code, a Slider object should be prepared by adding numbers from 0 to 100. All components are set to the average value (50). Event handlers include updating the values of the corresponding labels and height values of the corresponding rectangles (columns). The event handler associated with the text field contains a code that restricts the ability to enter numbers from 0 to 100.
The JavaFX application class will be as follows:
package ua.in.iwanoff.java.fifth;

import java.io.IOException;

import javafx.application.Application;
import javafx.fxml.FXMLLoader;
import javafx.scene.Scene;
import javafx.scene.layout.AnchorPane;
import javafx.stage.Stage;

public class DiagramWindow extends Application {

    @Override
    public void start(Stage primaryStage) {
        try {
            primaryStage.setTitle("Scalar Values");
            AnchorPane root = (AnchorPane)FXMLLoader.load(getClass().getResource("DiagramWindow.fxml"));
            Scene scene = new Scene(root, 700, 600);
            primaryStage.setScene(scene);
            primaryStage.show();
        }
        catch (IOException e) {
            e.printStackTrace();
        }
    }

    public static void main(String[] args) {
        launch(args);
    }
}
After starting the program and adjusting some settings, the main window of the program can be as follows:
3.3 Using LineChart for Plotting Trigonometric Functions
Among the classes derived from XYChart, the LineChart class, whose objects can be used to construct function graphs, is of particular interest. To construct a graphic, it is first necessary to prepare the dependence data in the form of a set of points. The amount of points should be large enough to make the curve smooth, but not too much, so as not to slow down the program's execution. The above program builds two trigonometric functions on one graph:
package ua.in.iwanoff.java.fifth;

import javafx.application.Application;
import javafx.scene.Scene;
import javafx.scene.chart.LineChart;
import javafx.scene.chart.NumberAxis;
import javafx.scene.chart.XYChart;
import javafx.stage.Stage;

import java.util.function.DoubleUnaryOperator;

public class LineChartDemo extends Application {
    @Override
    public void start(Stage primaryStage) {
        primaryStage.setTitle("Trigonometric Functions");
        Scene scene = new Scene(fgGraph(-4, 4, 1, -1.5, 1.5, 1,
                "Sine", Math::sin, "Cosine", Math::cos), 800, 350);
        primaryStage.setScene(scene);
        primaryStage.show();
    }

    private LineChart<Number, Number> fgGraph(double xFrom, double xTo, double xStep,
                                              double yFrom, double yTo, double yStep,
                                              String fName, DoubleUnaryOperator f,
                                              String gName, DoubleUnaryOperator g) {
        NumberAxis xAxis = new NumberAxis(xFrom, xTo, xStep);
        NumberAxis yAxis = new NumberAxis(yFrom, yTo, yStep);
        LineChart<Number, Number> graphChart = new LineChart<>(xAxis, yAxis);
        // Turn off the "symbols" in the points
        graphChart.setCreateSymbols(false);
        double h = (xTo - xFrom) / 100;
        // Add the name and points of the first function:
        XYChart.Series<Number, Number> fSeries = new XYChart.Series<>();
        fSeries.setName(fName);
        for (double x = xFrom; x <= xTo; x += h) {
            fSeries.getData().add(new XYChart.Data<>(x, f.applyAsDouble(x)));
        }
        // Add the name and points of the second function:
        XYChart.Series<Number, Number> gSeries = new XYChart.Series<>();
        gSeries.setName(gName);
        for (double x = xFrom; x <= xTo; x += h) {
            gSeries.getData().add(new XYChart.Data<>(x, g.applyAsDouble(x)));
        }
        // Add both functions:
        graphChart.getData().addAll(fSeries, gSeries);
        return graphChart;
    }

    public static void main(String[] args) {
        launch(args);
    }
}
The main window at runtime will be as follows:
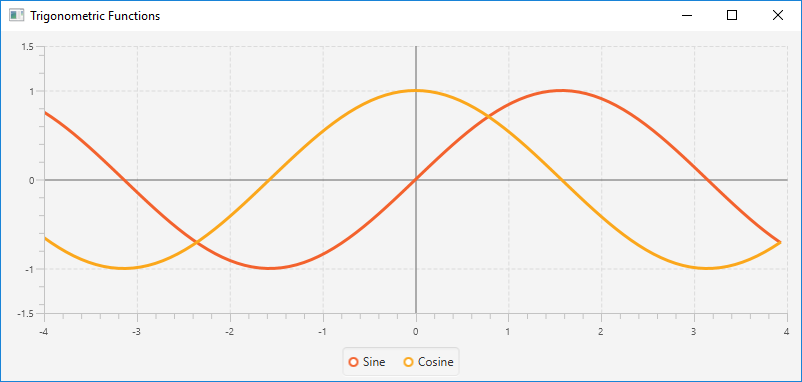
The disadvantage of this approach is the need to select a set of points instead of using a callback. The number of dots can be either insufficient (instead of a graphic we get a broken line) or excessive, which will slow down the plotting.
3.5 Creating a Class for Constructing Graphs of Functions Using Standard Geometric Shapes
Suppose we need to create a universal means for plotting several functions. These means should allow to determine the analytical dependencies and the range of graphs, color settings and the thickness of the graphs of individual functions, as well as the colors of the axes and the grid.
To ensure a universal approach to charting, we can use the callback function. In addition, it is appropriate for each function to set the color and thickness of the line. To describe directly the function, as well as the properties of a line representing a function, we can create an auxiliary class::
package ua.in.iwanoff.java.fifth;

import javafx.scene.paint.Paint;

import java.util.function.DoubleUnaryOperator;

public class FunctionData {
    private DoubleUnaryOperator operator;
    private Paint paint;
    private double width;

    public FunctionData(DoubleUnaryOperator operator, Paint paint, double width) {
        this.operator = operator;
        this.paint = paint;
        this.width = width;
    }

    public DoubleUnaryOperator getOperator() {
        return operator;
    }

    public Paint getPaint() {
        return paint;
    }

    public double getWidth() {
        return width;
    }
}
The class that is responsible for constructing graphs can be derived from the Pane class and added to the JavaFX objects tree. But a more simple approach involves creating a separate class, the object of which is created when necessary. This object will be bound to an empty panel that will contain graphs. It is advisable to use this approach. The reference to the panel to which the graph is added is stored in the object and is the required constructor parameter.
We can use standard geometric shapes to construct function graphs, including the Line (axes, grid) and Polyline (directly graph) lines. The corresponding objects are added to the panel, depending on the origin and scale.
The class that is responsible for plotting graphs will look like this:
package ua.in.iwanoff.java.fifth;

import javafx.scene.layout.Pane;
import javafx.scene.paint.Color;
import javafx.scene.paint.Paint;
import javafx.scene.shape.Line;
import javafx.scene.shape.Polyline;
import javafx.scene.text.Text;

import java.util.ArrayList;
import java.util.List;
import java.util.function.DoubleUnaryOperator;

public class GraphBuilder {
    // Number of steps to calculate the minimum and maximum of functions:
    public static double STEPS = 100;
    // Minimum indent from axes and graphics along the vertical axis:
    public static double VERTICAL_GAP = 0.2;
    // The visibility threshold of the grid lines:
    public static double MIN_PIXELS = 20;
    // Grid step threshold:
    public static double SCALE_STEP = 10;
    // Minimum indent from axes:
    public static double MIN_GAP = 2;
    // Indent from the edge of the picture:
    public static double MAX_GAP = 10;
    // Number output format:
    public static String FORMAT = "%5.2f";


    // Approximate computation of the minimum of a function at a certain interval:
    public static double minY(double from, double to, DoubleUnaryOperator operator) {
        double min = operator.applyAsDouble(from);
        double h = (to - from) / STEPS;
        for (double x = from + h; x <= to; x += h) {
            double y = operator.applyAsDouble(x);
            if (min > y) {
                min = y;
            }
        }
        return min;
    }

    // Approximate calculation of the maximum of a function at a certain interval:
    public static double maxY(double from, double to, DoubleUnaryOperator operator) {
        double max = operator.applyAsDouble(from);
        double h = (to - from) / STEPS;
        for (double x = from + h; x <= to; x += h) {
            double y = operator.applyAsDouble(x);
            if (max < y) {
                max = y;
            }
        }
        return max;
    }

    // A panel that will display a graph:
    private Pane pane;

    // Colors of the grid and axes:
    private Color gridColor = Color.LIGHTGRAY;
    private Color axesColor = Color.BLACK;

    // Functions to display:
    private List<FunctionData> funcs = new ArrayList<>();

    // In the constructor, we define the panel for plotting:
    public GraphBuilder(Pane pane) {
        this.pane = pane;
    }

    public Color getGridColor() {
        return gridColor;
    }

    public void setGridColor(Color gridColor) {
        this.gridColor = gridColor;
    }

    public Color getAxesColor() {
        return axesColor;
    }

    public void setAxesColor(Color axesColor) {
        this.axesColor = axesColor;
    }

    public void clearFunctions() {
        funcs.clear();
    }

    public void addFunction(DoubleUnaryOperator operator, Paint paint, double width) {
        FunctionData func = new FunctionData(operator, paint, width);
        funcs.add(func);
    }

    // Plotting:
    public void drawGraph(double xMin, double xMax) {
        // Determine and calculate the range of the function:
        double yMin = -VERTICAL_GAP;
        double yMax = VERTICAL_GAP;
        for (FunctionData func : funcs) {
            double min = minY(xMin, xMax, func.getOperator());
            double max = maxY(xMin, xMax, func.getOperator());
            if (yMin > min) {
                yMin = min;
            }
            if (yMax < max) {
                yMax = max;
            }
        }
        yMin -= VERTICAL_GAP * Math.abs(yMin);
        yMax += VERTICAL_GAP * Math.abs(yMax);
        // The size of the graph:
        double width = pane.getWidth();
        double height = pane.getHeight();
        // Scales:
        double xScale = width / (xMax - xMin);
        double yScale = height / (yMax - yMin);
        // Coordinates of the origin projection:
        double x0 = -xMin * xScale;
        double y0 = yMax * yScale;
        pane.getChildren().clear();

        // Grid:
        double xStep = 1; // grid step
        // Change the step if the grid lines are too frequent:
        while (xStep * xScale < MIN_PIXELS)
            xStep *= SCALE_STEP;
        // Change the step if the grid lines are too rare:
        while (xStep * xScale > MIN_PIXELS * SCALE_STEP)
            xStep /= SCALE_STEP;
        // Vertical grid lines:
        for (double dx = xStep; dx < xMax; dx += xStep) {
            double x = x0 + dx * xScale;
            Line line = new Line(x, 0, x, height);
            line.setStroke(gridColor);
            pane.getChildren().add(line);
            pane.getChildren().add(new Text(x + MIN_GAP, MAX_GAP, String.format(FORMAT, dx)));
        }
        for (double dx = -xStep; dx >= xMin; dx -= xStep) {
            double x = x0 + dx * xScale;
            Line line = new Line(x, 0, x, height);
            line.setStroke(gridColor);
            pane.getChildren().add(line);
            pane.getChildren().add(new Text(x + MIN_GAP, MAX_GAP, String.format(FORMAT, dx)));
        }
        double yStep = 1;  // grid step
        // Change the step if the grid lines are too frequent:
        while (yStep * yScale < MIN_PIXELS) {
            yStep *= SCALE_STEP;
        }
        // Change the step if the grid lines are too rare:
        while (yStep * yScale > MIN_PIXELS * SCALE_STEP)
            yStep /= SCALE_STEP;
        // Horizontal grid lines:
        for (double dy = yStep; dy < yMax; dy += yStep) {
            double y = y0 - dy * yScale;
            Line line = new Line(0, y, width, y);
            line.setStroke(gridColor);
            pane.getChildren().add(line);
            pane.getChildren().add(new Text(MIN_GAP, y - MIN_GAP, String.format(FORMAT, dy)));
        }
        for (double dy = -yStep; dy > yMin; dy -= yStep) {
            double y = y0 - dy * yScale;
            Line line = new Line(0, y, width, y);
            line.setStroke(gridColor);
            pane.getChildren().add(line);
            pane.getChildren().add(new Text(MIN_GAP, y - MIN_GAP, String.format(FORMAT, dy)));
        }

        // Axes:
        Line verticalAxis = new Line(x0, 0, x0, height);
        verticalAxis.setStroke(axesColor);
        pane.getChildren().add(verticalAxis);
        Line horizontalAxis = new Line(0, y0, width, y0);
        pane.getChildren().add(horizontalAxis);
        pane.getChildren().add(new Text(MIN_GAP, y0 - MIN_GAP, "0.0"));
        pane.getChildren().add(new Text(MIN_GAP, y0 - MIN_GAP, "0.0"));
        pane.getChildren().add(new Text(width - MAX_GAP, y0 - MIN_GAP, "X"));
        pane.getChildren().add(new Text(x0 + MIN_GAP, MAX_GAP, "Y"));

        // Functions:
        for (FunctionData func : funcs) {
            Polyline polyline = new Polyline();
            polyline.setStroke(func.getPaint());
            polyline.setStrokeWidth(func.getWidth());
            for (double x = 0; x < width; x++) {
                double dx = (x - x0) / xScale;
                double dy = func.getOperator().applyAsDouble(dx);
                double y = y0 - dy * yScale;
                polyline.getPoints().addAll(x, y);
            }
            pane.getChildren().add(polyline);
        }
    }
}
Note: constants in class code are created and used in order to prevent the bad practice of using explicit numbers in the code of functions (the so-called anti-pattern "Magic Numbers").
The GraphBuilder class contains the following fields: a reference to the panel in which graphing is carried out, grid and axis colors, as well as a list of function descriptions that we build (a list of FunctionData objects). This list may be empty. In this case, drawing axes and grids without function graphs will be performed.
The drawGraph() function receives the interval for changing the argument (xMin and xMax), which can be common to all functions. Depending on the interval of change of functions, the range of y should be defined so that the graphs of all functions are fully displayed. To determine the range of y, we can create separate methods. The variables yMin and yMax will store the beginning and end of the range of y.
Note: universal tools for constructing function graphs can also provide manual determination of the range of y.
In the drawGraph() function, the work is carried out with two coordinate systems: real world coordinates associated with mathematical functions and coordinates of points inside the panel. In the following code of this function, the names of the variables dx and dy are used for real coordinates, and for the coordinates of the points, the names of the points are x and y. It should be remembered that the vertical axis of the real world coordinates and the coordinates of points on the panel are directed in opposite directions. This will affect the definition of the formulas for calculating coordinates.
To build graphs, the scales xScale and yScale (the number of points in units of real world coordinates) are determined. Next, the coordinates of a point on the panel x0 and y0, into which the origin of world coordinates is projected, are determined.
The function sequentially builds vertical and horizontal grid lines in four directions from the origin, and then builds the axes. Objects of the Line class are applied to the grid lines and axes, and PolyLine are applied to the graphs.
Now you can use the GraphBuilder class in the JavaFX application:
package ua.in.iwanoff.java.fifth;

import javafx.application.Application;
import javafx.scene.Scene;
import javafx.scene.layout.AnchorPane;
import javafx.scene.paint.Color;
import javafx.stage.Stage;

public class ShapesGraph  extends Application {

    @Override
    public void start(Stage primaryStage) {
        primaryStage.setTitle("Functions");
        AnchorPane pane = new AnchorPane();
        GraphBuilder builder = new GraphBuilder(pane);
        builder.addFunction(Math::sin, Color.CYAN, 1);
        builder.addFunction(Math::cos, Color.BLUE, 2);
        // It is very important to build a chart after determining the size of the panel:
        Scene scene = new Scene(pane,  1000, 350);
        builder.drawGraph(-4, 6);
        primaryStage.setScene(scene);
        primaryStage.show();
    }

    public static void main(String[] args) {
        launch(args);
    }
}
The main window at runtime will be as follows:
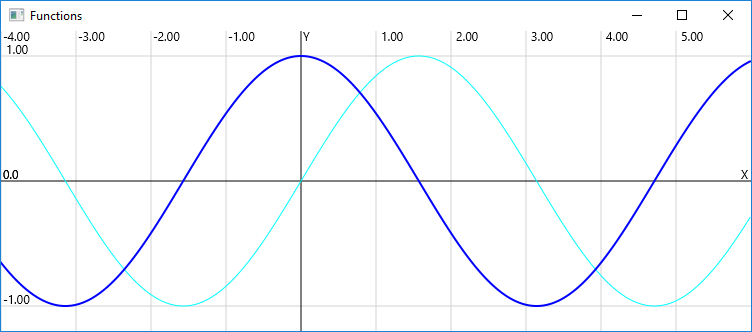
If in the list of actual arguments of the drawGraph() method, you specify an interval wider (for example, drawGraph(-50, 100)), or narrower (for example, drawGraph(-0.1, 0.6)), the program will recalculate the grid step. It is recommended to verify this yourself.
4 Exercises
- Create a graphical user interface program that displays concentric circles. Use the
Canvasclass. - Perform a previous exercise using standard geometric shapes.
- Perform a previous exercise using
PieChart.
5 Quiz
- What is the idea behind a test-driven development paradigm?
- What is the assertions mechanism used for?
- How to configure the software environment so that you can use assertions?
- What is unit testing?
- What is JUnit?
- How to annotate JUnit testing methods?
- How to logically group the tests?
- How to use JUnit in the software environment?
- What are the standard graphical tools provided by Java?
- What is the difference between the declarative approach to the construction of graphic images and the imperative one?
- What are the levels of implementation of 2D graphics in JavaFX?
- How to use the
Canvasclass tools? - How do I work with standard graphic primitives?
How to work with charts and graphs in JavaFX?